



Gistly
Subscribe to newsletter
Thank you! Your submission has been received!
Oops! Something went wrong while submitting the form.

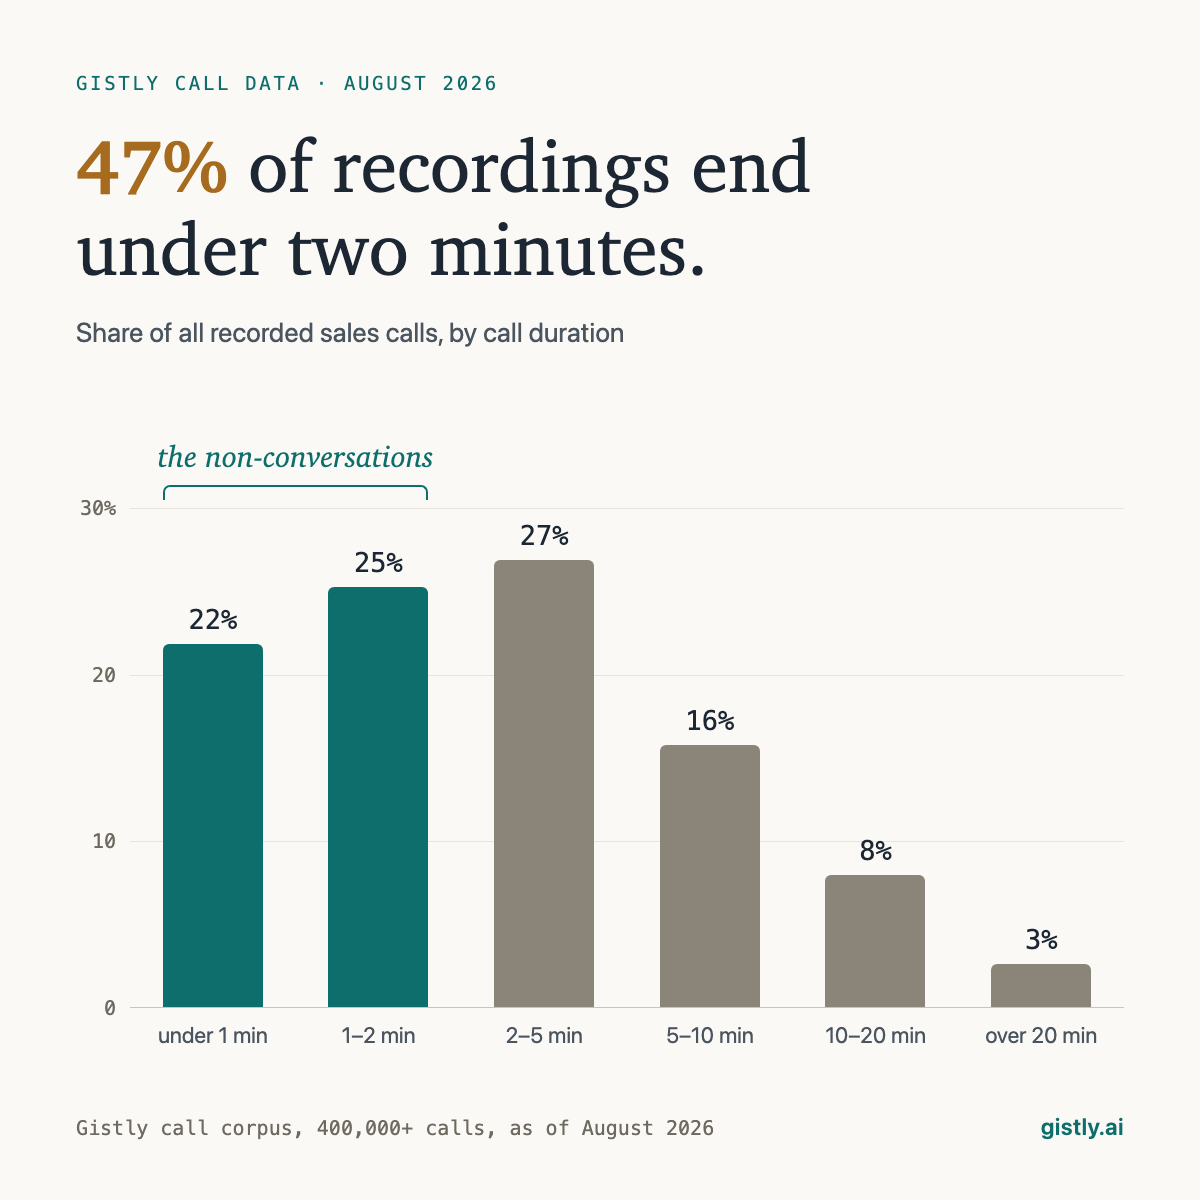
We analyzed over 400,000 recorded sales calls, more than 30,000 hours of audio. Nearly half ended in under two minutes. One in five never crossed the first minute.
Those numbers surprise nobody who has run an outbound floor. Every sales leader knows most dials do not connect: voicemails, instant hangups, wrong numbers, "call me later" brush-offs that last eleven seconds. The connect rate is a fact of life, and teams manage it as one.
Here is the part that gets missed. Modern dialers and telephony stacks record everything, and everything means everything. The voicemail gets a recording. The four-second hangup gets a recording. Each of those recordings lands in the same pool as your real conversations, and that pool is what your quality program draws from. The non-connects do not just waste airtime. They contaminate two of the most important numbers your QA function produces.
Most manual QA programs review a small slice of calls, typically 1 to 2 percent, sampled more or less at random from the recording pool. Random sampling has an underrated property: the sample inherits the composition of the pool. If half the pool is voicemails and instant hangups, half of your sample is voicemails and instant hangups.
Play that forward. Your auditors sit down to review their weekly allocation, and every second recording contains no conversation at all. There is nothing to score, nothing to coach, nothing to learn. Half of your audit effort, half of the salary cost, half of the calendar time, goes to calls where nothing happened.
The arithmetic on the other side is worse. A roughly 2 percent sample, applied to a pool where only about half the recordings are real conversations, means a real conversation gets reviewed roughly once in a hundred. The calls that carry all of the risk, the mis-selling, the missed discovery, the compliance slips, are precisely the calls your program almost never sees.
The second distortion is quieter and harder to catch, because it hides inside an average.
Run a ninety-second call against a full quality rubric and it fails everything. No opening, because the prospect hung up. No discovery, no objection handling, no closing, because there was no conversation to have. The rep did nothing wrong, and the scorecard reads like a disaster.
Leave those calls in the denominator and your "quality score" stops measuring quality. It becomes a blend of two unrelated things: how well your reps sell, and how often phones get answered. When list quality dips or a carrier has a bad week, your connect rate falls, your short-call share rises, and your quality score sinks, with not a single rep selling any differently. Teams then chase the phantom: retraining on openings that were never given a chance to happen, coaching against a number that was never about coaching.
This is not a hypothetical. In a real deployment, a scoring template showed entire parameters failing for every single call. Every call, zero percent pass. Read at face value, the floor had a catastrophic skills problem.
It did not. The cause was non-connected calls being scored as if they were conversations. Short recordings with no dialogue were being run through parameters that assume a dialogue exists, and they failed them all, dragging the aggregate to the floor. The fix was not a coaching program. It was a classification gate.
None of this is sophisticated. That is rather the point. The distortion comes from a default nobody chose, and it disappears the moment someone chooses otherwise.
Pull the duration histogram from your dialer. It is a five-minute export. If a large share of short calls is sitting inside your QA averages, your quality number is not measuring what you think it measures, and your auditors are spending real hours on calls that never happened.
All figures in this article trace to a read-only snapshot of the Gistly production corpus taken on August 13, 2026. The snapshot queries are archived and reproducible. Exact counts appear once, here; the article body uses rounded figures by house style.
Gistly classifies every call automatically, gates non-connects out of your quality metrics, and scores 100 percent of real conversations. Bring your own duration histogram and we will walk through it together. Book a walkthrough.
30 minutes. No SDR, no script. Book directly with Ashit, founder of Gistly.